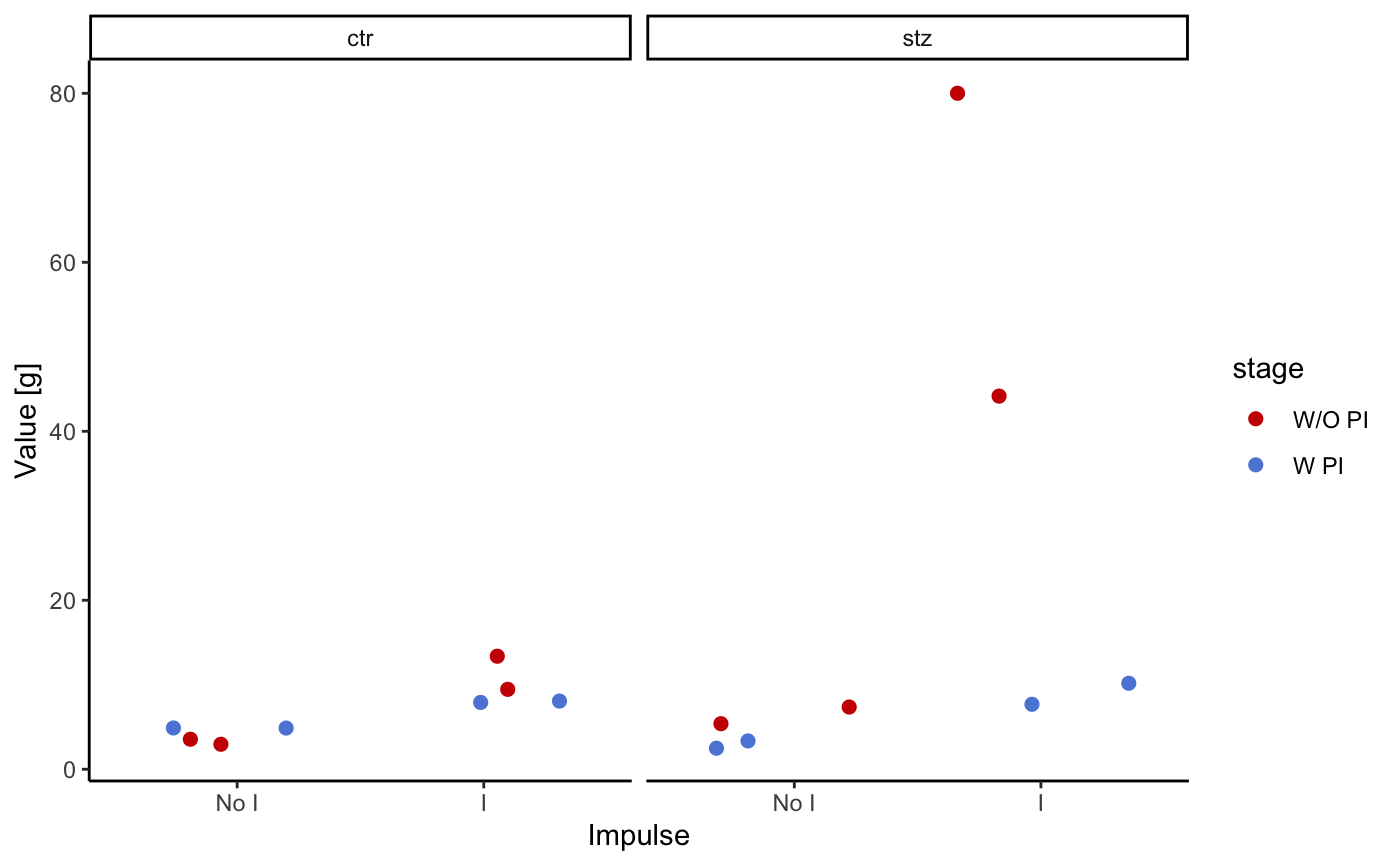
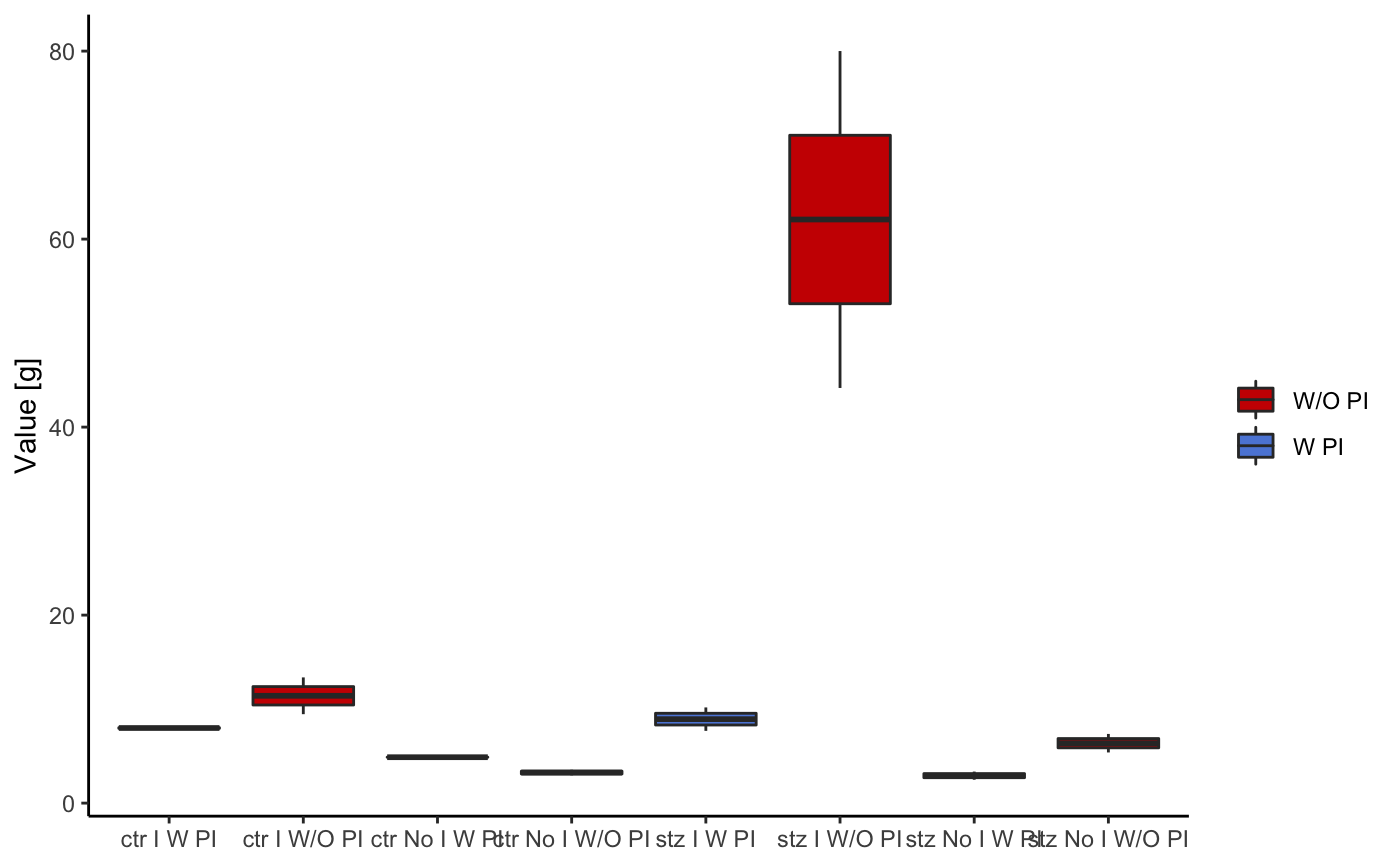
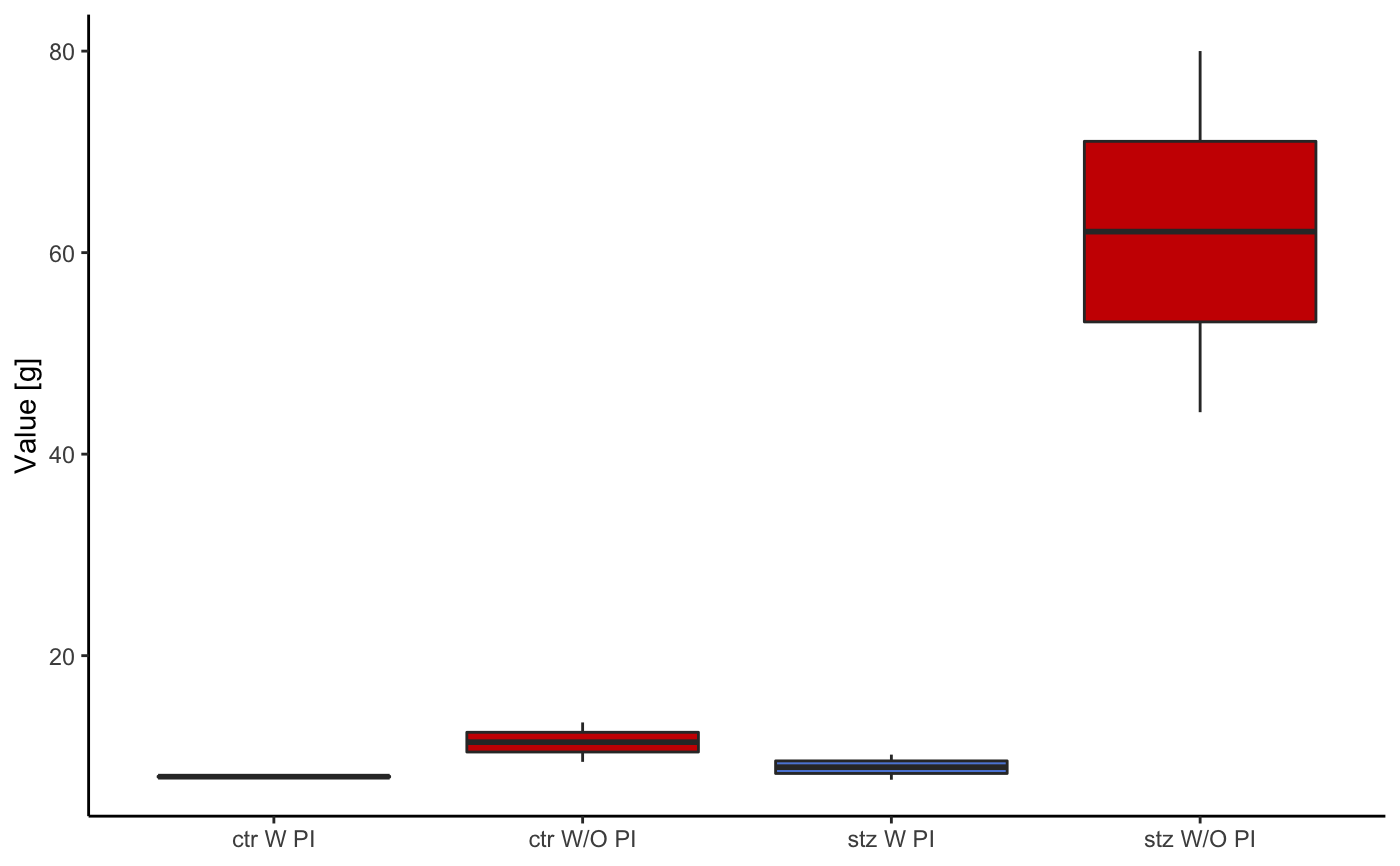
Returns several types of plots, based on the type argument. Type 1 returns a dot plot portraying mean values during the pulse and between pulses for tested groups; type 2, returns a similar result as type 1, but as a boxplot; type 3 displays only values pertaining to pulse period; type 4 displays distribution of values as violin plots; type 5 is a time-series plot with all startle tries overlapped, color indicates whether prepulse was used; type 6 is a boxplot displaying ratio of values recorded during pulse and in between pulses.
startlePlot(df, type, filter_major_groups, yrange, n_col)
Arguments
| df | A dataframe returned by loadStartleData function. |
|---|---|
| type | Obligatary argument. A number 1, 2 or 3 that specifies which plot will be returned. For more information see th vignette. |
| filter_major_groups | An optional argument, a vector of strings used for filtering the data and displaying only wished major groups on plots. |
| yrange | An optional argument used for zooming in. Should be defined as a vector with min and max y axis values (e.g. c(0,10) - y axis will have min value of 0 and max value of 10 ) |
| n_col | An optional argument, defines number of graph columns. |
Value
Returns several types of plots based on type.
Examples
# Load example data
df <- ratpasta_demo

# running examples
startlePlot(df, type = 1)startlePlot(df, type = 2)startlePlot(df, type = 3)